
پرونده:Involutes of a cubic curve.svg

حجم پیشنمایش PNG این SVG file:۶۰۰ × ۶۰۰ پیکسل کیفیتهای دیگر: ۲۴۰ × ۲۴۰ پیکسل | ۴۸۰ × ۴۸۰ پیکسل | ۷۶۸ × ۷۶۸ پیکسل | ۱٬۰۲۴ × ۱٬۰۲۴ پیکسل | ۲٬۰۴۸ × ۲٬۰۴۸ پیکسل | ۱٬۴۴۰ × ۱٬۴۴۰ پیکسل.
پروندهٔ اصلی (پروندهٔ اسویجی، با ابعاد ۱٬۴۴۰ × ۱٬۴۴۰ پیکسل، اندازهٔ پرونده: ۵۹ کیلوبایت)
این پرونده در ویکیانبار موجود است. محتویات صفحهٔ توصیف آن در زیر نمایش داده میشود. |
خلاصه
| توضیح |
English: Desc
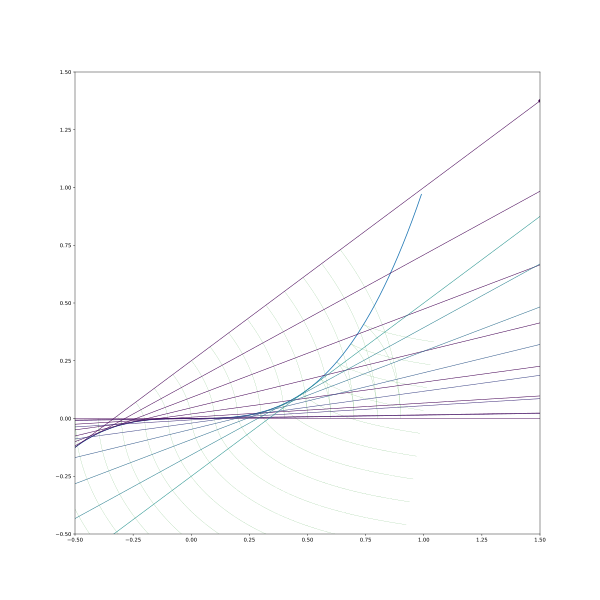
Python codeimport numpy as np
import matplotlib.pyplot as plt
from scipy.integrate import quad # numerical integration
import matplotlib.cm as cm # for colormaps
def involute(f, df, x0, l0, dxs):
"""
f: the function that produces the curve
df: the derivative. That is, df(x) = f'(x)
x0: the origin point
l0: the string length at origin point
dxs: the differential points at which to plot the involute.
Assumed to be sorted in increasing order
returns f_xs, f_ys, inv_xs, inv_ys
"""
f_xs = x0 + dxs
f_ys = f(f_xs)
inv_xs = np.zeros(len(dxs))
inv_ys = np.zeros(len(dxs))
arclength_integrand = lambda x: np.sqrt(1 + df(x)**2)
for i in range(len(dxs)):
x = x0 + dxs[i]
arclength = quad(arclength_integrand, x0, x)[0]
string_length = l0 - arclength
string_angle = np.arctan(df(x))
inv_xs[i] = f_xs[i] + string_length * np.cos(string_angle)
inv_ys[i] = f_ys[i] + string_length * np.sin(string_angle)
return f_xs, f_ys, inv_xs, inv_ys
def plot_line(x, y, slope, dxmin, dxmax, **kwargs):
plt.plot([x+dxmin, x+dxmax], [y+dxmin*slope, y+dxmax*slope],
**kwargs)
f = lambda x: x**3
df = lambda x: 3 * x**2
f_xs, f_ys, inv_xs, inv_ys = involute(f, df, 0, l0=0.8, dxs=np.arange(200) / 100 - 1)
y_x_ratio = 1
plt.figure(figsize=(16, int(16*y_x_ratio)))
plt.plot(f_xs, f_ys)
for l0 in np.arange(20)/10-1:
f_xs, f_ys, inv_xs, inv_ys = involute(f, df, 0, l0=l0, dxs=np.arange(200) / 100 - 0.5)
plt.plot(inv_xs, inv_ys, color='green', linewidth=0.2)
for x in np.linspace(-0.5, 0.5, 15):
y = f(x)
slope = df(x)
plot_line(x, y, slope, -1, +2, color=cm.viridis(x), marker='o',markersize=5, linewidth=1)
xlim_low = -0.5
xlim_width = 2
ylim_low = -0.5
plt.xlim(xlim_low, xlim_low + xlim_width)
plt.ylim(ylim_low, ylim_low + xlim_width * y_x_ratio)
plt.savefig("involutes of a cubic curve.svg")
plt.show()
|
| تاریخ | |
| منبع | اثر شخصی |
| پدیدآور | Cosmia Nebula |
اجازهنامه
من، صاحب حقوق قانونی این اثر، به این وسیله این اثر را تحث اجازهنامهٔ ذیل منتشر میکنم:
این پرونده تحت پروانهٔ Creative Commons Attribution-Share Alike 4.0 International منتشر شده است.
- شما اجازه دارید:
- برای به اشتراک گذاشتن – برای کپی، توزیع و انتقال اثر
- تلفیق کردن – برای انطباق اثر
- تحت شرایط زیر:
- انتساب – شما باید اعتبار مربوطه را به دست آورید، پیوندی به مجوز ارائه دهید و نشان دهید که آیا تغییرات ایجاد شدهاند یا خیر. شما ممکن است این کار را به هر روش منطقی انجام دهید، اما نه به هر شیوهای که پیشنهاد میکند که مجوزدهنده از شما یا استفادهتان حمایت کند.
- انتشار مشابه – اگر این اثر را تلفیق یا تبدیل میکنید، یا بر پایه آن اثری دیگر خلق میکنید، میبایست مشارکتهای خود را تحت مجوز same or compatible license|یکسان یا مشابه با اصل آن توزیع کنید.
تاریخچهٔ پرونده
روی تاریخ/زمانها کلیک کنید تا نسخهٔ مربوط به آن هنگام را ببینید.
| تاریخ/زمان | بندانگشتی | ابعاد | کاربر | توضیح | |
|---|---|---|---|---|---|
| کنونی | ۴ سپتامبر ۲۰۲۳، ساعت ۰۶:۰۷ | | ۱٬۴۴۰ در ۱٬۴۴۰ (۵۹ کیلوبایت) | Cosmia Nebula | Uploaded while editing "Involute" on en.wikipedia.org |
کاربرد پرونده
صفحهٔ زیر از این تصویر استفاده میکند:
کاربرد سراسری پرونده
ویکیهای دیگر زیر از این پرونده استفاده میکنند:
- کاربرد در en.wikipedia.org
- کاربرد در fi.wikipedia.org